Weather Station v1.0
Learning Objectives
- Read analog temperature data from an LM35 sensor and convert to Celsius
- Measure ambient light level using an LDR (photoresistor) voltage divider
- Display live readings via the Arduino Serial Monitor
- Understand analog-to-digital conversion (ADC) fundamentals
Overview
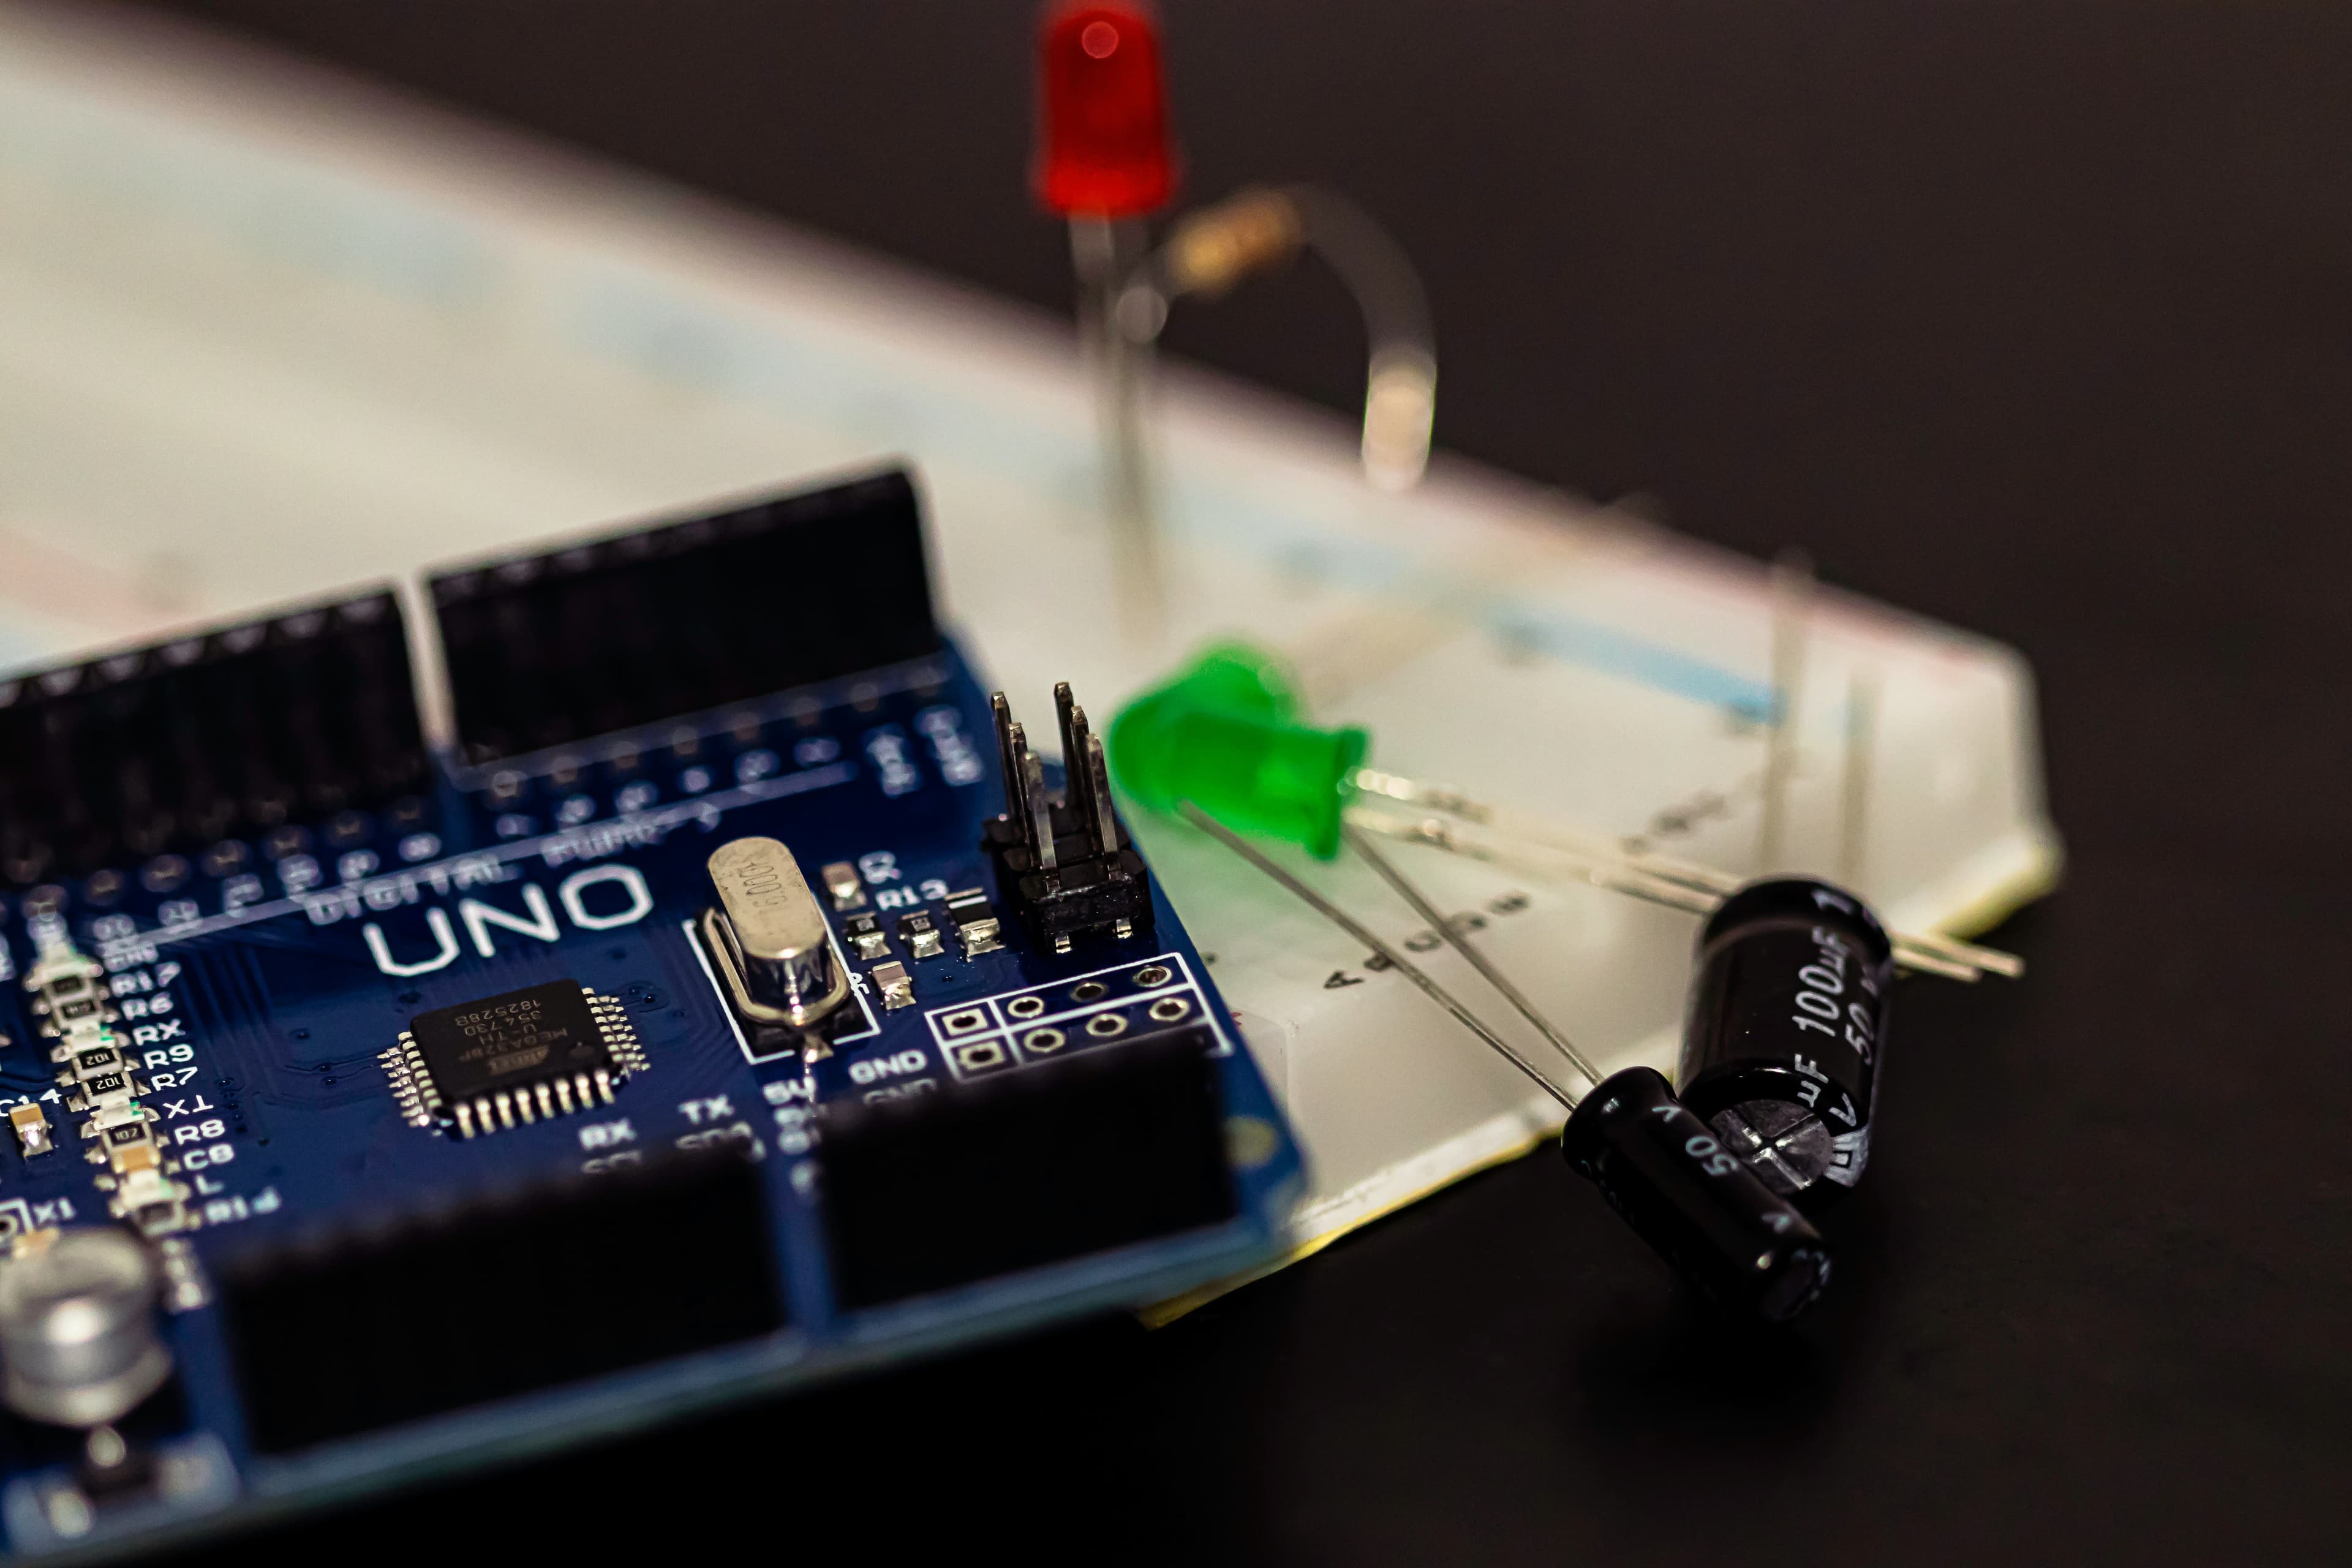
Build a two-sensor weather station that measures temperature (LM35) and light intensity (LDR) and prints live data to the Arduino Serial Monitor. This is your first foray into analog sensing — converting real-world physical quantities into numbers a microcontroller can process.
Good to Know
The Arduino Uno's ADC has 10-bit resolution, meaning it maps 0–5 V into 0–1023 discrete integer values. A reading of 512 represents approximately 2.5 V. The conversion formula is: Voltage = (ADC_value / 1023.0) × 5.0
Components Required
| Component | Quantity | Notes |
|---|---|---|
| Arduino Uno R3 | 1 | Any 5 V Arduino works |
| LM35 Temperature Sensor | 1 | TO-92 package, 10 mV/°C |
| LDR (Photoresistor) | 1 | GL5528 or equivalent |
Circuit Setup
The LM35 has three pins (flat side facing you, left to right): VCC – VOUT – GND
- VCC → Arduino 5 V
- VOUT → Arduino A0
- GND → Arduino GND
Polarity Check
Before powering on, use a multimeter to verify ~5 V between VCC and GND of the LM35. A reverse-connected LM35 gets hot very quickly and will be damaged — check the flat side orientation carefully.
Form a voltage divider: 5 V → LDR → junction point → 10 kΩ → GND
Connect the junction point to A1. As light increases, LDR resistance drops, and the voltage at A1 rises.
Arduino Sketch
// Weather Station v1.0

const int TEMP_PIN = A0;
const int LDR_PIN  = A1;

void setup() {
  Serial.begin(9600);
  Serial.println("=== Weather Station v1.0 ===");
  Serial.println("Time(s)\tTemp(C)\tLight(%)");
}

void loop() {
  // --- Temperature ---
Good to Know
map(value, fromLow, fromHigh, toLow, toHigh) is a built-in Arduino function that linearly scales a value from one range to another. Here it converts 0–1023 ADC units into 0–100% for the light reading.
Reading the Data
- Upload the sketch to Arduino Uno.
- Open Tools → Serial Monitor (or press
Ctrl+Shift+M). - Set baud rate to 9600.
- Readings print every second in tab-separated format.
Data Logger Experiment
Copy 30 rows of Serial Monitor output into a spreadsheet (Google Sheets or Excel). Plot temperature vs. time as a line graph. Cover the LDR with your palm and observe the light% column drop in real time. What happens to temperature if you hold the LM35 between your fingers?
Calibration
The LM35's datasheet accuracy is ±0.5 °C typically. To calibrate:
- Place the sensor in ice water (0 °C reference) — read the ADC value.
- Place in boiling water (100 °C reference) — read the ADC value.
- Use the two points to create a linear calibration formula:
T = m × ADC + b
Two-Point Calibration
Perform the calibration above. Update the sketch to apply your m and b constants. Compare calibrated vs. uncalibrated readings against a reference thermometer.
Extension: Add an LCD Display
Replace Serial Monitor output with a 16×2 I²C LCD (address 0x27). Add the LiquidCrystal_I2C library and display temperature on row 1, light level on row 2. This makes the station truly standalone — no laptop needed.